Obiettivi | Certificazione | Contenuti | Tipologia | Prerequisiti | Durata e Frequenza | Docenti | Modalità di Iscrizione | Calendario
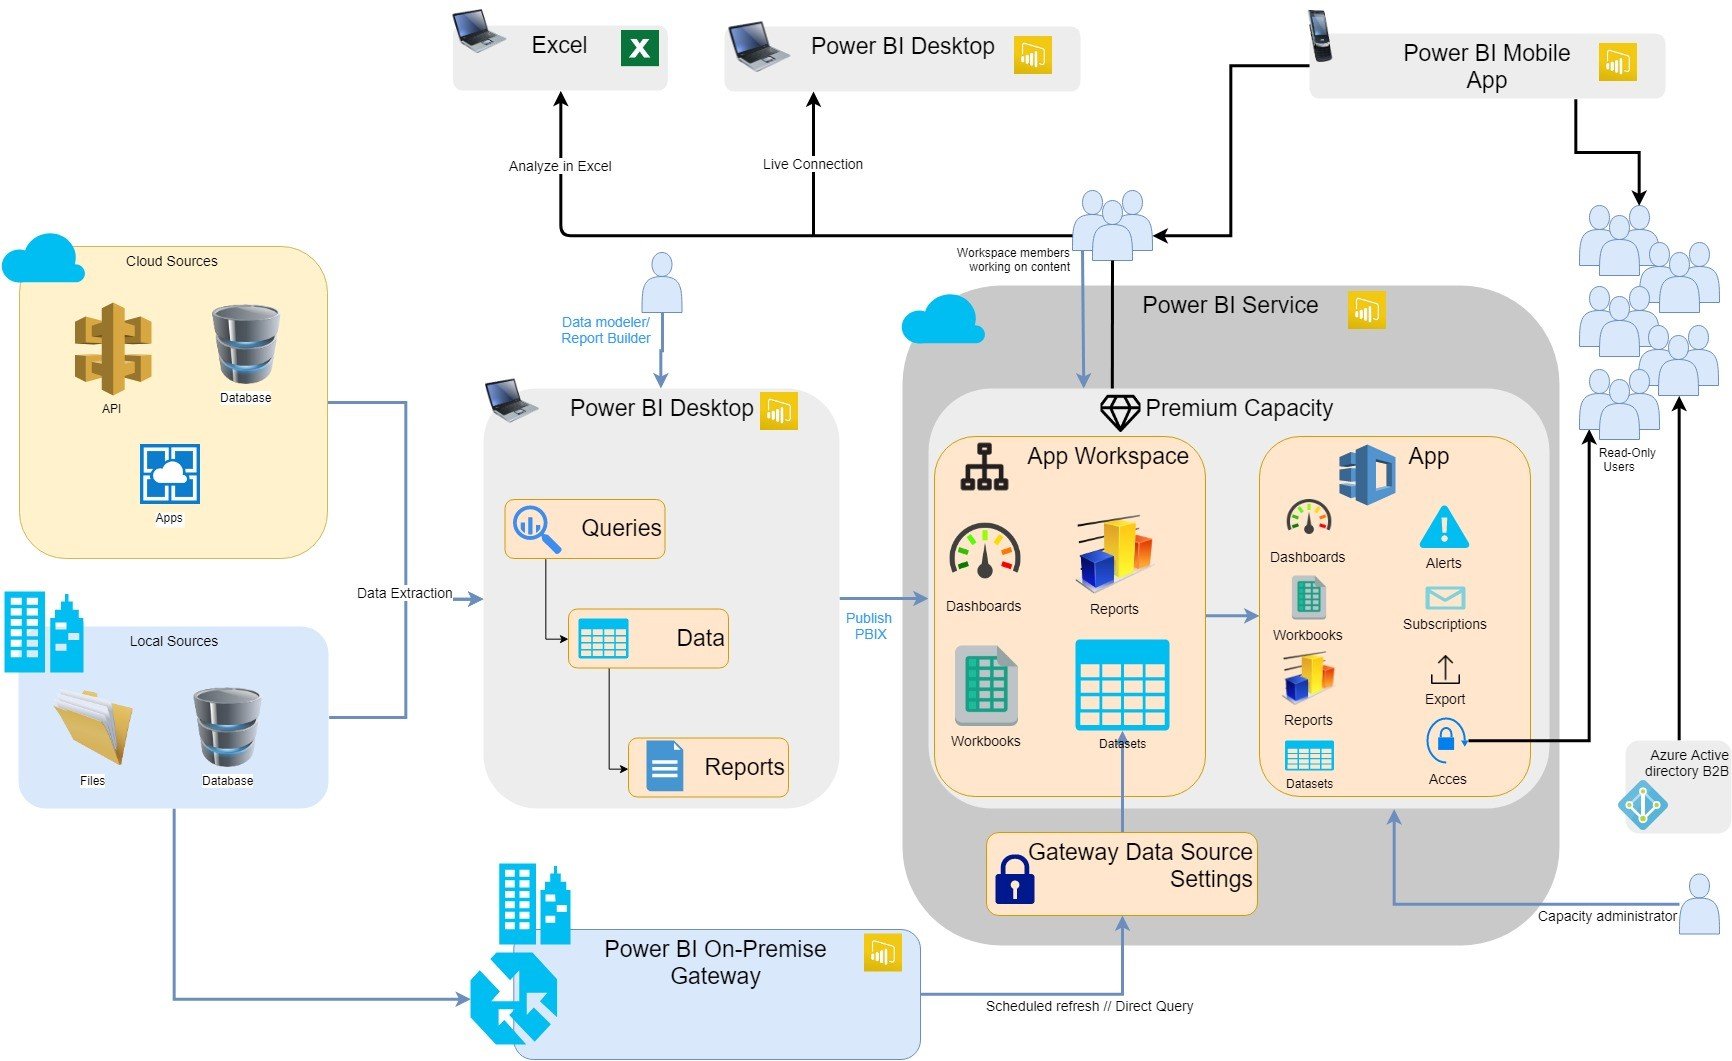
Il Corso PL-300 Power BI Data Analyst (Design and manage analytics solutions using Power BI) è progettato per partecipanti che devono trasformare dati aziendali in insight fruibili tramite Power BI, lavorando end-to-end su data preparation, modeling, visualization e governance. Il percorso parte dall’acquisizione e gestione delle fonti dati, includendo configurazione di credentials e privacy levels, scelta tra DirectQuery e Import, e uso di parameters per rendere i dataset riutilizzabili. La fase di trasformazione è centrata su Power Query, con profiling, data cleaning, gestione errori di import, trasformazioni (pivot/unpivot/transpose), conversione di semi-structured data in tabelle, e costruzione di una base solida con fact tables e dimension tables. Si passa poi al data modeling in Power BI, con definizione di relationships (cardinality e cross-filter direction), role-playing dimensions, creazione di una common date table e ottimizzazione del modello eliminando colonne/righe inutili e riducendo la granularity. Le calcolazioni sono sviluppate con DAX, includendo measures, CALCULATE, time intelligence, statistical functions, semi-additive measures, quick measures e calculation groups, con attenzione alle performance tramite Performance Analyzer e DAX query view. La parte di reporting copre scelta e configurazione dei visuals, themes, conditional formatting, slicing/filtering, drill-through, bookmarks, tooltips, interazioni tra visuals, layout per mobile e accessibilità, includendo anche quando usare un paginated report e funzionalità assistive come Copilot per narrative visual e report authoring. Infine, il corso affronta la gestione nel Power BI service: workspaces, workspace app, dashboards, content distribution, subscriptions e data alerts, scheduled refresh e gateway quando necessario, insieme a security e governance con workspace roles, item-level access, accesso ai semantic models, Row-Level Security (RLS) e sensitivity labels.
Contattaci ora per ricevere tutti i dettagli e per richiedere, senza alcun impegno, di parlare direttamente con uno dei nostri Docenti (Clicca qui)
oppure chiamaci subito al nostro Numero Verde (800-177596).
Calling from abroad? Reach us at +39 02 87168254.
Obiettivi del corso
Di seguito una sintesi degli obiettivi principali del corso Corso Power BI Data Analyst PL-300:
- Connettere e gestire data sources in Power BI configurando credentials, privacy levels, parameters e modalità DirectQuery/Import.
- Preparare e trasformare i dati con Power Query (profiling, cleaning, merge/append, pivot/unpivot, fact/dimension tables).
- Progettare un data model efficiente con relationships, date table, role-playing dimensions e performance optimization.
- Creare calculations e visual calculations con DAX (measures, CALCULATE, time intelligence, calculation groups) e ottimizzare con Performance Analyzer/DAX query view.
- Pubblicare e governare contenuti nel Power BI service con workspaces, dashboards, refresh/gateway, RLS e sensitivity labels.
Certificazione del corso
Esame PL-300 Microsoft Power BI Data Analyst; Questo esame valuta le competenze del candidato nel preparare, modellare e distribuire soluzioni analytics con Power BI, con focus su Power Query e DAX. I topics testati includono data preparation: connessione a data sources o a un shared semantic model, gestione di data source settings (credentials e privacy levels), scelta tra DirectQuery e Import, creazione di parameters, data profiling e data cleaning (data quality issues, null values, import errors) e trasformazioni con Power Query (data types, create/transform columns, group/aggregate, pivot/unpivot/transpose, conversione di semi-structured data, merge/append, keys e data loading configuration). L’esame copre data modeling: configurazione di table/column properties, role-playing dimensions, relationships (cardinality e cross-filter direction), common date table, calculated columns/tables e DAX calculations (measures, CALCULATE, time intelligence, statistical functions, semi-additive measures, quick measures, calculation groups), oltre a performance optimization con riduzione di righe/colonne, riduzione granularity e analisi con Performance Analyzer e DAX query view. La sezione visualize and analyze include report design (visual selection, formatting, themes, conditional formatting, slicing/filtering, paginated report usage), usability/storytelling (bookmarks, tooltips, interactions, navigation, sync slicers, drill-through, export, mobile layout, accessibility, automatic page refresh) e analisi di pattern/trend (Analyze feature, grouping/binning/clustering, AI visuals, forecasting, outliers/anomalies, Copilot features). Infine, manage and secure include workspaces e assets (workspace app, publish/update items, dashboards, distribution methods, subscriptions/data alerts, promote/certify content, gateway need, scheduled refresh) e governance/security (workspace roles, item-level access, semantic model access, RLS e sensitivity labels).
Contenuti del corso
Prepare the Data
- Connect to data sources / shared semantic model, configure credentials e privacy levels
- Choose DirectQuery vs Import, create/modify parameters
- Data profiling e data cleaning (data quality issues, null values, import errors)
- Transform data with Power Query: pivot/unpivot/transpose, group/aggregate, semi-structured to table
- Build fact tables/dimension tables, merge/append queries e configure data loading
Model the Data
- Configure table/column properties e implement role-playing dimensions
- Define relationships: cardinality e cross-filter direction, create common date table
- Create DAX measures e calculations (CALCULATE, time intelligence, statistical, semi-additive)
- Create calculated tables/columns, quick measures e calculation groups
- Optimize model performance con Performance Analyzer e DAX query view
Visualize and Analyze the Data
- Build reports: choose visuals, format/configure, themes, conditional formatting, slicers/filters
- Use paginated reports when appropriate e create visual calculations with DAX
- Enhance storytelling: bookmarks, tooltips, visual interactions, navigation, drill-through, sync slicers
- Design for mobile e accessibility, configure export e automatic page refresh
- Identify patterns/trends: Analyze feature, grouping/binning/clustering, AI visuals, forecasting, outliers/anomalies, Copilot features
Manage and Secure Power BI
- Create/configure workspaces e workspace app, publish/import/update items
- Create dashboards e choose content distribution methods
- Configure subscriptions, data alerts, promote/certify content
- Configure semantic model scheduled refresh e identify when a gateway is required
- Implement governance/security: workspace roles, item-level access, semantic model access, RLS e sensitivity labels
Tipologia
Corso di Formazione con Docente
Docenti
I docenti sono Istruttori Autorizzati Microsoft e in altre tecnologie IT, con anni di esperienza pratica nel settore e nella Formazione.
Infrastruttura laboratoriale
Per tutte le tipologie di erogazione, il Corsista può accedere alle attrezzature e ai sistemi presenti nei Nostri laboratori o direttamente presso i data center del Vendor o dei suoi provider autorizzati in modalità remota. Ogni partecipante dispone di un accesso per implementare le varie configurazioni avendo così un riscontro pratico e immediato della teoria affrontata. Ecco di seguito alcuni scenari tratti dalle attività laboratoriali:
Dettagli del corso
Prerequisiti
- Si consiglia la partecipazione al Corso Azure Data Fundamentals.
Durata del corso
- Durata Intensiva 3gg;
Frequenza
Varie tipologie di Frequenza Estensiva ed Intensiva.
Date del corso
- Corso Microsoft Power BI Data Analyst (Formula Intensiva) – 08/06/2026 – 09:00 – 17:00
Modalità di iscrizione
Le iscrizioni sono a numero chiuso per garantire ai tutti i partecipanti un servizio eccellente.
L’iscrizione avviene richiedendo di essere contattati dal seguente Link, o contattando la sede al numero verde 800-177596 o inviando una richiesta all’email [email protected].